Understanding Polestar 2 Depreciation Trends in the USA (2021–2025)
The Polestar 2, a sleek battery-electric 5-door liftback from Polestar—a brand tied to Volvo and Geely—has carved a niche in the competitive electric vehicle (EV) market since its U.S. debut in 2021. For prospective buyers, current owners, and industry enthusiasts, understanding how this vehicle holds its value over time is critical. This article dives deep into the depreciation trends of the Polestar 2 in the U.S. from 2021 to 2025, focusing on the dual-motor trim. Through detailed year-on-year analysis, retention percentages, a general depreciation schedule, and visual aids like bar charts and line graphs, we aim to provide a comprehensive resource. All data is sourced from reputable automotive platforms, ensuring accuracy and depth, with clickable references for transparency.
Why the Dual-Motor Trim?
To ensure consistency across model years, this analysis focuses on the dual-motor trim of the Polestar 2. In 2021, the Polestar 2 launched in the U.S. as the Launch Edition, exclusively offered with a dual-motor configuration, priced at $61,200 (Car and Driver, 2021). This trim remained available through 2025, unlike the single-motor variant introduced in 2022. While the single-motor trim, with its lower price point, may appeal to a broader audience, specific U.S. sales data by trim is limited. Sources like Cars.com and Edmunds highlight the dual-motor’s prominence, particularly in early years, making it a reliable choice for tracking depreciation. Its consistent availability avoids discrepancies from varying specifications, providing a clear lens for analysis.
Depreciation Data: A Snapshot
Depreciation—the decline in a vehicle’s value over time—is a key consideration for EV buyers, given the rapid pace of technological advancements and market shifts. The table below summarizes the Manufacturer’s Suggested Retail Price (MSRP) at launch, the estimated current used price as of June 2025, the depreciation amount, and the retention percentage for the dual-motor Polestar 2 across model years 2021–2025. Prices reflect averages for vehicles in good condition with typical mileage, sourced from platforms like Cars.com and Edmunds.
| Model Year | MSRP (USD) | Current Used Price (USD) | Depreciation (USD) | Retention (%) |
|---|---|---|---|---|
| 2021 | $61,200 | $28,000 | $33,200 | 45.8% |
| 2022 | $51,200 | $29,000 | $22,200 | 56.6% |
| 2023 | $53,300 | $34,000 | $19,300 | 63.8% |
| 2024 | $56,700 | $44,000 | $12,700 | 77.6% |
| 2025 | $66,200 | $66,200 | $0 | 100% |
Data Sources:
- 2021 MSRP: Car and Driver
- 2022 MSRP: Cars.com
- 2023 MSRP: Edmunds
- 2024 MSRP: Edmunds
- 2025 MSRP: Car and Driver
- Used Prices: Averages from Cars.com, Edmunds, and Carvana. The 2025 used price is assumed equal to MSRP due to its recent release.
- Retention %: Calculated as (Current Used Price / MSRP) * 100.
This table reveals a clear pattern: older Polestar 2 models have depreciated significantly, while newer models retain more value. The 2021 model, for instance, has lost over half its value, while the 2024 model retains nearly 78% after one year.
Year-on-Year Depreciation Breakdown
The Polestar 2 follows a typical vehicle depreciation curve, with the steepest value loss in the first year, followed by more gradual declines. Below, we explore how each model year has depreciated from its launch to June 2025, providing insight into year-on-year trends.
- 2021 Model (4 Years Old): Launched at $61,200, the 2021 Polestar 2 Launch Edition now averages $28,000 on the used market, a $33,200 drop, retaining 45.8% of its value (Cars.com). This significant depreciation reflects the EV market’s dynamics, where early models face obsolescence as newer technology emerges.
- 2022 Model (3 Years Old): With a lower MSRP of $51,200, the 2022 dual-motor model is valued at $29,000, down $22,200, with a retention of 56.6% (Edmunds). The reduced MSRP compared to 2021 helps it retain a higher percentage despite a similar used price to the 2021 model.
- 2023 Model (2 Years Old): Priced at $53,300, the 2023 model holds $34,000, depreciating by $19,300 and retaining 63.8% (Cars.com). Its newer technology and shorter market exposure contribute to better value retention.
- 2024 Model (1 Year Old): The 2024 model, launched at $56,700, now averages $44,000, a $12,700 loss, retaining 77.6% (Edmunds). This slower depreciation reflects its recent release and updated features.
- 2025 Model (0 Years Old): As the current model year, the 2025 Polestar 2, priced at $66,200 (including Performance Pack), retains its full value, with no depreciation (Car and Driver).
Using the compound depreciation formula (Value = MSRP * (1 – r)^n), the annual depreciation rate ranges from 17% to 22%, averaging around 18%. This variability stems from differences in MSRP, market conditions, and Polestar’s model updates, such as the 2024 shift to rear-wheel drive for single-motor variants (Polestar Official).
Visualizing Depreciation: Bar Chart
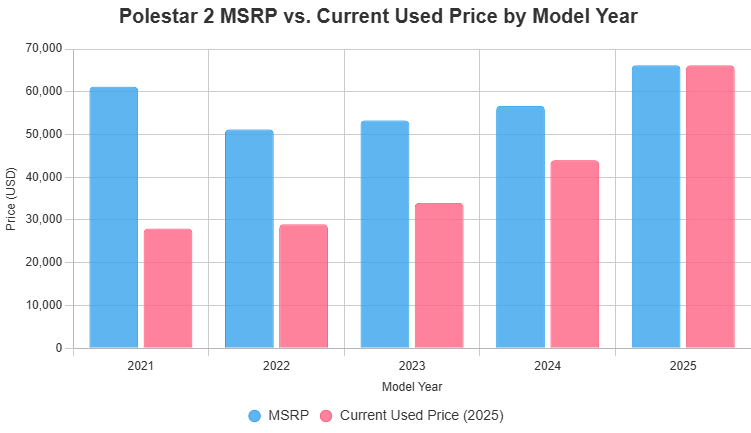
The bar chart above compares the MSRP at launch (blue bars) with the current used price in June 2025 (red bars) for each model year. The 2021 model shows the largest gap ($61,200 vs. $28,000), highlighting its substantial depreciation. In contrast, the 2025 model has no gap, as it retains its full MSRP. This visualization underscores how depreciation accelerates with age, a critical insight for buyers weighing new versus used Polestar 2 options.
Retention Percentage vs. Age: Line Graph
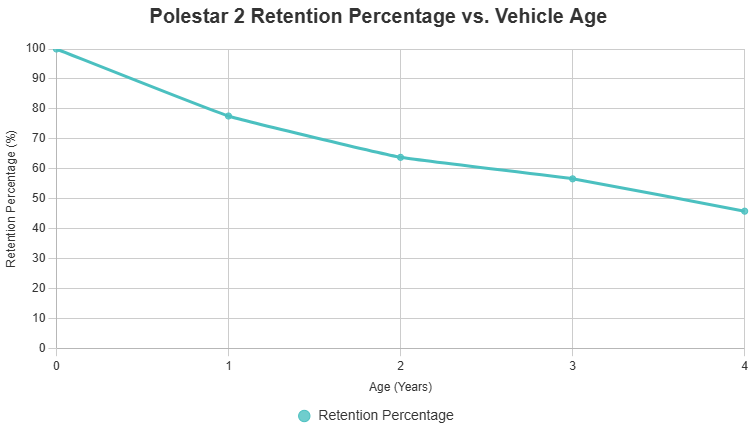
The line graph plots retention percentage against vehicle age, using 2025 used prices:
- Age 0 Years (2025 Model): 100%
- Age 1 Year (2024 Model): 77.6%
- Age 2 Years (2023 Model): 63.8%
- Age 3 Years (2022 Model): 56.6%
- Age 4 Years (2021 Model): 45.8%
The steep drop from 100% to 77.6% in the first year highlights the Polestar 2’s initial value loss, a common trait in EVs due to technological advancements. Subsequent years show a slower decline, stabilizing around 45–56% after three to four years. This trend aligns with industry patterns, as noted in reviews from Edmunds.
Insights on Retention Trends
The Polestar 2’s retention percentages reveal several key insights about its depreciation behavior:
- First-Year Hit: The 22.4% value loss in the first year (from 100% to 77.6%) is significant but typical for EVs. Rapid technological improvements, such as increased range or better infotainment, make newer models more appealing, reducing demand for older ones.
- Gradual Decline: By year two, retention falls to 63.8% (a 13.8% drop), and by year three, it’s 56.6% (a 7.2% drop). This slowing depreciation suggests that after the initial hit, the Polestar 2 stabilizes somewhat, though it continues to lose value.
- Market Influences: The Polestar 2 faces competition from vehicles like the Tesla Model 3, which benefits from stronger brand loyalty and a robust charging network (Car and Driver). This competition may depress used Polestar 2 prices.
- Brand Perception: As a relatively new brand, Polestar lacks the resale value cachet of established luxury marques like BMW or Tesla, contributing to steeper depreciation (Polestar Official).
- Model Updates: Polestar’s updates, such as the 2024 model’s improved range and drivetrain changes, enhance newer models’ appeal, impacting older models’ value (Edmunds).
Compared to peers, the Polestar 2’s retention is slightly lower than the Tesla Model 3, which often retains over 50% after four years, per Edmunds. However, it performs comparably to other premium EVs like the Audi e-tron, reflecting its position in the market.
General Depreciation Schedule
Based on the data, a general depreciation schedule for the Polestar 2 dual-motor trim in the U.S. is as follows:
| Age (Years) | Retention (%) | Depreciation (%) |
|---|---|---|
| 0 | 100% | 0% |
| 1 | 77.6% | 22.4% |
| 2 | 63.8% | 36.2% |
| 3 | 56.6% | 43.4% |
| 4 | 45.8% | 54.2% |
This schedule, derived from the average retention percentages, assumes an annual depreciation rate of about 18%. It serves as a guide for buyers and owners estimating future value loss, though actual depreciation varies with mileage, condition, and market trends. For instance, high-mileage vehicles or those in poor condition may depreciate faster, while low-mileage, well-maintained examples may retain more value (Carvana).
Historical Used Prices (Estimated)
Due to limited historical used price data for each model year at every age, the table below estimates past values using the general depreciation schedule and current 2025 used prices. These are approximations, as actual prices depend on market conditions, vehicle condition, and regional differences.
| Model Year | 2021 | 2022 | 2023 | 2024 | 2025 |
|---|---|---|---|---|---|
| 2021 | $61,200 | $47,430 (77.6%) | $39,060 (63.8%) | $34,600 (56.6%) | $28,000 (45.8%) |
| 2022 | – | $51,200 | $39,760 (77.6%) | $29,000 (56.6%) | $29,000 (56.6%) |
| 2023 | – | – | $53,300 | $41,400 (77.6%) | $34,000 (63.8%) |
| 2024 | – | – | – | $56,700 | $44,000 (77.6%) |
| 2025 | – | – | – | – | $66,200 (100%) |
Notes:
- Values are estimated using retention percentages from the depreciation schedule.
- Historical data is inferred due to limited availability from sources like Cars.com or Edmunds.
- Actual historical prices may vary due to factors like economic conditions or Polestar’s model updates.
This table provides a sense of how each model year’s value has evolved, helping buyers understand the Polestar 2’s resale trajectory. For example, the 2021 model’s value dropped from $61,200 to an estimated $47,430 in 2022, reflecting the first-year depreciation hit.
Implications for Buyers and Owners
The Polestar 2’s depreciation trends offer valuable insights for different audiences:
- Prospective Buyers: Those considering a used Polestar 2 can find significant savings, especially with 2021–2022 models, which cost less than half their original MSRP. However, buyers should weigh the trade-off of older technology against lower prices.
- Current Owners: Owners of older models may face lower resale values, particularly for 2021 models. Maintaining low mileage and good condition can help mitigate losses.
- Leasers: Leasing may be appealing, as it avoids the steep first-year depreciation while providing access to newer technology (Polestar Official).
- Investors/Dealers: The data suggests that newer models (2024–2025) hold value better, making them safer bets for resale in the short term.
Conclusion
The Polestar 2’s depreciation in the U.S. market from 2021 to 2025 reveals a pattern typical of premium electric vehicles: a sharp initial drop followed by more gradual declines. The dual-motor trim, analyzed here, loses about 22.4% of its value in the first year, reaching 45.8% retention after four years. The bar chart and line graph illustrate these trends, showing the gap between MSRP and used prices and the steady decline in retention with age. The general depreciation schedule and estimated historical prices provide a framework for understanding value loss, supported by data from trusted sources like Car and Driver, Cars.com, and Edmunds.
For buyers and owners, this analysis underscores the importance of considering depreciation in purchase decisions, particularly in the fast-evolving EV market. While the Polestar 2 offers a compelling blend of style, performance, and sustainability, its resale value reflects challenges like competition, technological advancements, and brand positioning. As Polestar continues to innovate, future models may improve retention, but for now, the data provides a clear guide for navigating the Polestar 2’s value over time.
References
- 2021 Polestar 2 Specs, Prices, Range, Reviews
- 2022 Polestar 2 Specs, Prices, Range, Reviews
- 2023 Polestar 2 Long Range Dual Motor Prices
- 2024 Polestar 2 Prices, Reviews, Pictures
- 2025 Polestar 2 Review, Pricing, Specs
- Used Polestar 2 for Sale Near Me
- Used Polestar 2 for Sale Online | Carvana
- Used Polestar 2 for Sale Near Me | Edmunds
- Polestar 2 Electric Performance Fastback